RShiny app for data visualization of REAP results
The landing screen of the REAP demo Shiny app
🎯 Project objective
Build an interactive interface for biologists to explore Rapid Extracellular Antigen Profiling (REAP) per patient and/or per molecule.
📋 Project description
Design and implement an interface for biologists to explore data in a visual way.
The interface allows biologists to explore the data in three panels.
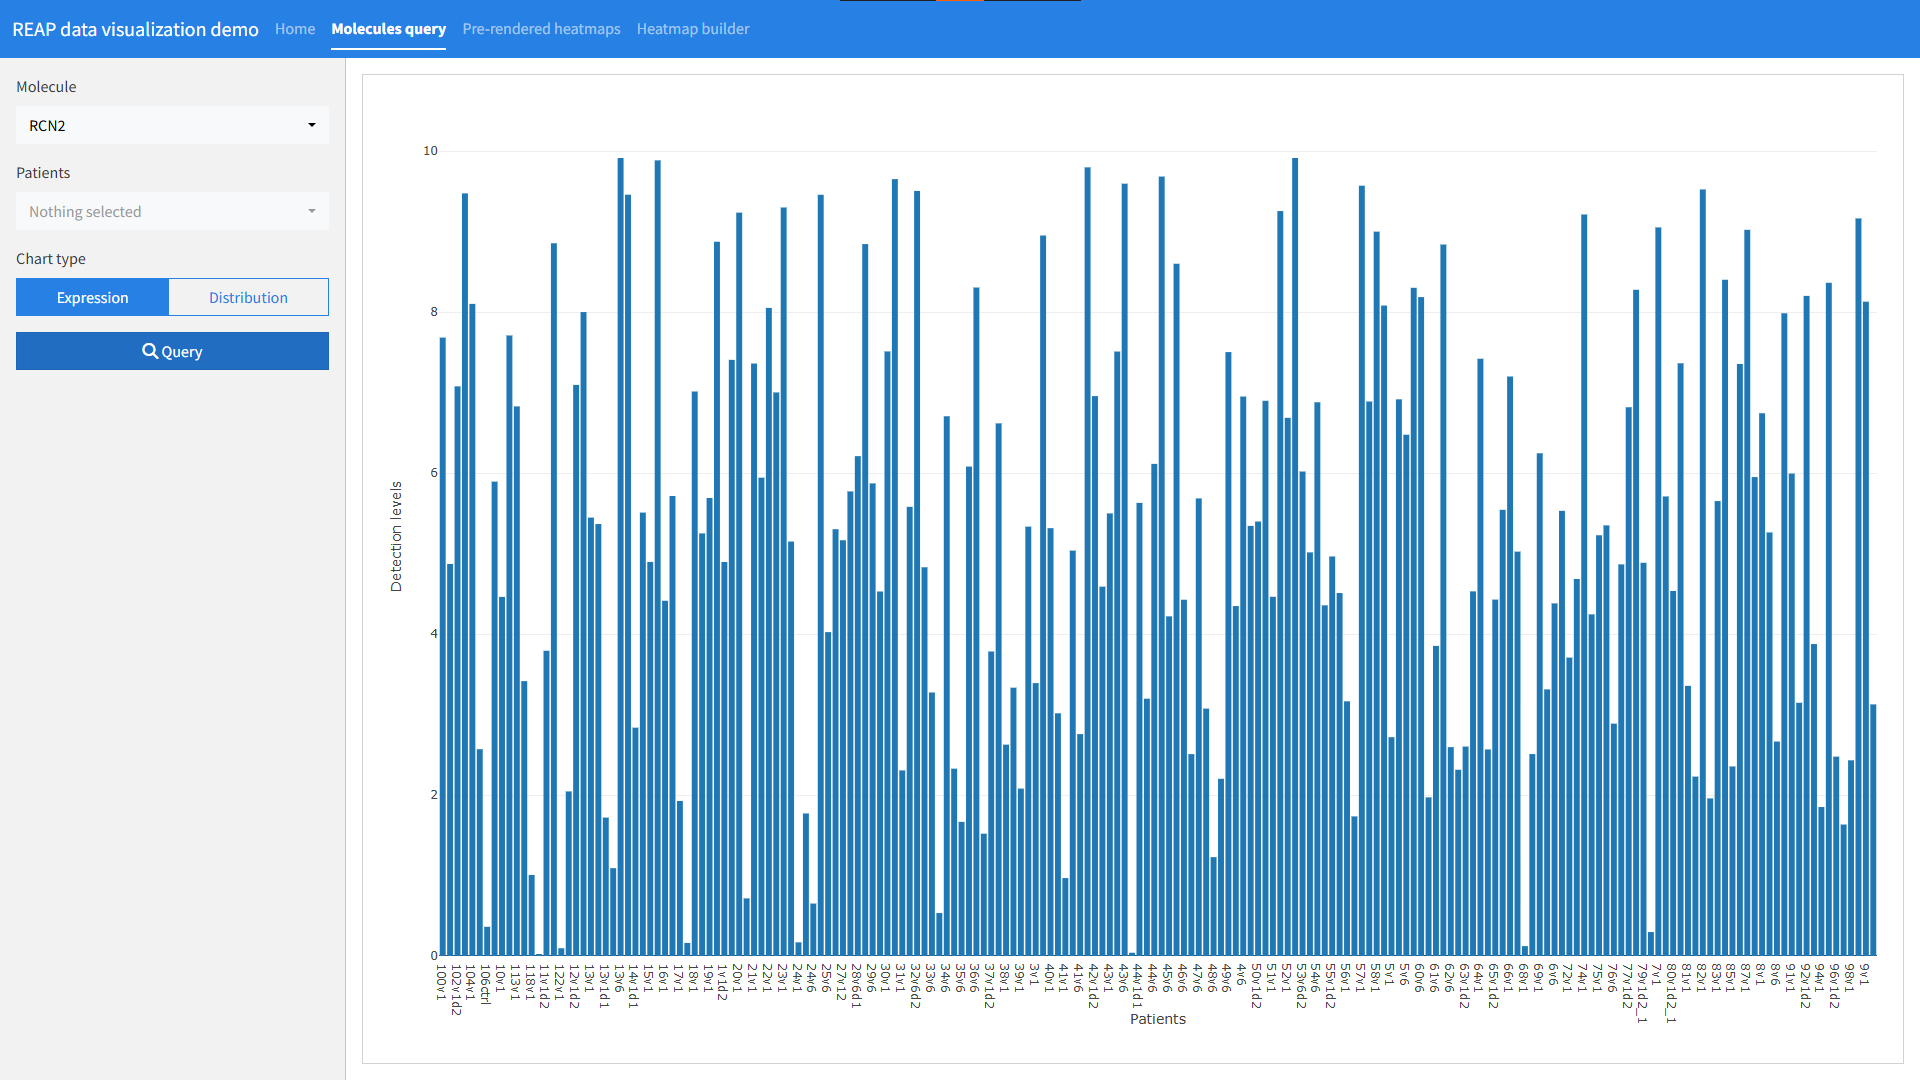
Query molecules and visualize either expression per patient of the expression distribution in the whole population or selected individuals group
Vizualise and explore heatmaps for which antigen groups and patients populations were defined to be of interest by Dr Poudrier
Build custom heatmaps by selecting antigens and patients from both lists
🎨 Design & implementation decisions
R programming language
Interactive interface and deployment using RShiny
Choice of graphs and visuals with end-users for optimal usability
🧾 Key takeaway
RShiny
Usefulness of interactive data exploration for clients